How Fast Does a GoThru Virtual Tour Load?
We tested a GoThru Virtual Tour in a cold-cache Chrome session to see how quickly it becomes visible and how the viewer reduces the wait for 360 images.
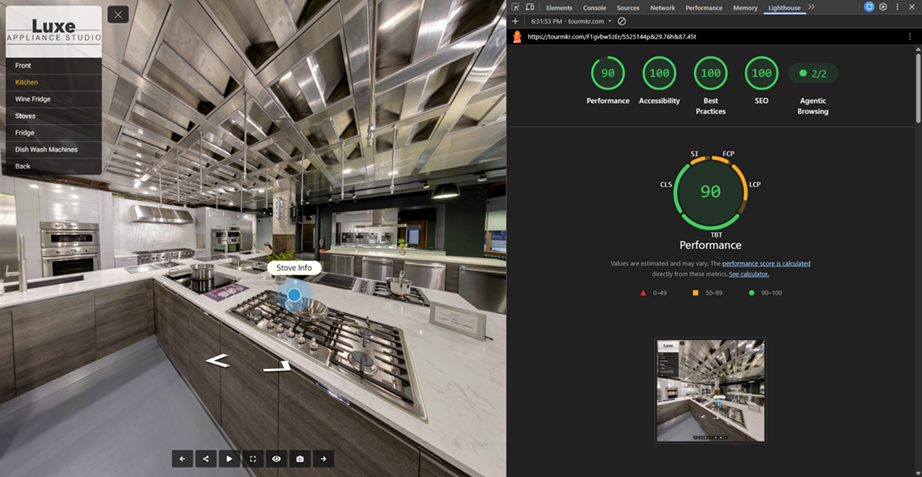
A virtual tour asks more from a browser than a normal webpage. It has to build an interactive viewer, load detailed 360 imagery and respond while someone looks around or moves to the next panorama. We wanted to see how a published GoThru tour handles that work during a first visit.
We tested one tour with Lighthouse Test, which loads a public page in a real Chrome browser and records what appears, what the browser downloads and where it spends time.
This was a single cold-cache test from a New York server at 1920 by 1080 pixels. "Cold cache" means the browser started without previously downloaded tour files. The test did not apply network throttling.
There is one other limitation that matters. The test server rendered the tour with software WebGL on its CPU and did not have a physical GPU. A modern computer or phone with graphics acceleration should render the panorama faster. The results are still useful because they show how the tour is delivered and which work happens first.
What the test measured
The first visible change appeared after 0.6 seconds. The browser's normal page-load event completed in 1.57 seconds, and the main visible content appeared at 2.54 seconds. The full sequence of background requests finished after 6.32 seconds.
| Measurement | Result | What it means |
|---|---|---|
| First visible change | 0.60 seconds | The visitor sees a response quickly. |
| Main visible content | 2.54 seconds | The primary tour view is on screen. |
| Page-load event | 1.57 seconds | The basic page has loaded. |
| Speed Index | 3.50 seconds | Most of the visible screen fills in over this period. |
| Layout shift | 0 | The page did not jump around while loading. |
| Fully loaded | 6.32 seconds | Remaining images and background work had finished. |
| Total transfer | 4.0 MB | Most of the transferred data was panorama imagery. |
| Requests | 84 | Every recorded request returned successfully. |
The performance coach score was 76 out of 100. That score gives us a useful summary, but the timing sequence tells the more important story: the tour started showing content well before every image request had finished.
1. GoThru shows the tour before every file has arrived
Waiting for the whole tour to download before drawing anything would leave the visitor staring at a blank page. This run did the opposite. Something appeared at 0.6 seconds, while the last background work completed several seconds later.
That sequence shows that the viewer prioritizes the first useful scene, then continues loading the material it needs in the background. The network trace supports that reading: almost 90 percent of the transferred bytes began loading after the main content had appeared.
2. Panoramas are delivered as smaller cube images
A 360 panorama is a large image. Sending one enormous flat file would create a long wait and force the browser to process more than it may need at once.
The test recorded 47 requests for cube-image pieces at the active image level. These pieces form the sides of the 360 scene. The browser can request several of them at the same time instead of waiting for one oversized panorama file.
Images accounted for 3.6 MB, or about 90 percent of the transferred data. JavaScript accounted for 297 KB. In other words, most of the download was the photography the visitor came to see, not a large application shell.
3. Heavy imagery is kept on a separate image host
The main page and the panorama imagery came from different GoThru hosts. The image host handled 49 requests and approximately 90 percent of all transferred bytes.
Separating those jobs lets the main tour page stay focused on launching the viewer while the image system delivers the visual content. The browser also made up to nine requests at the same time during the run.
4. Modern HTTP delivers many files efficiently
The browser used HTTP/3 for 74 of the 84 requests and HTTP/2 for the rest. Both protocols help the browser fetch many files efficiently, which matters when the first tour view is assembled from several cube images.
5. Compression reduces the code sent to the browser
The server used Brotli or gzip compression on 22 responses, including text, code and data files. Compression does not make much difference to JPEG panorama tiles because those images are already compressed, but it reduces the supporting files needed to start and run the viewer.
The test transferred 4.23 MB over the network while the uncompressed contents represented 5.31 MB. The browser received less data than it would have without text compression.
6. Caching helps after the first visit
A cold-cache test cannot reuse files from an earlier visit. It is deliberately testing the harder first-load case.
Even so, the responses show what happens next. Fifty-one of the 84 requests were marked for caching for at least one day. Forty-nine static assets had an approximately 90-day cache setting and were marked as unchanging.
That means a returning visitor can reuse unchanged files instead of downloading the same material again. It also helps when someone moves through a tour and the viewer needs an image piece it has already fetched.
What still took time
The weak point in this run was CPU work. The report measured 24 long CPU tasks totaling 4.76 seconds and 2.26 seconds of Total Blocking Time. The testing tool itself notes that this measurement depends heavily on the speed of the computer or phone.
That matters here because the server used CPU-based software rendering instead of a GPU. The result shows a real worst-case constraint, but it should not be treated as the exact experience on a modern graphics-equipped device.
The test also suggested two smaller improvements for the regular page imagery: allow a non-critical image to decode asynchronously and provide a modern image format where possible. Those are useful follow-up items, not evidence that the current tour failed to load.
What we learned
The GoThru tour did not wait for all 4 MB of content before responding. It displayed its first visual change in 0.6 seconds, kept the layout stable, loaded the main scene while other image pieces continued to arrive and prepared many static files for reuse.
The CPU-only environment made interaction metrics slower than we would expect on a modern GPU-equipped device. A single lab test also cannot describe every visitor, connection or tour. It can show whether the delivery strategy is doing sensible work, and this one was: load the first scene early, divide panorama imagery into manageable pieces, use modern HTTP, compress supporting files and cache what does not change.
You can run a free website speed test on a public page and inspect the same types of timing, image and network evidence. To learn how GoThru builds and hosts interactive tours, visit the GoThru Virtual Tour Creator.