
GoThru Google Statistics (GStats)
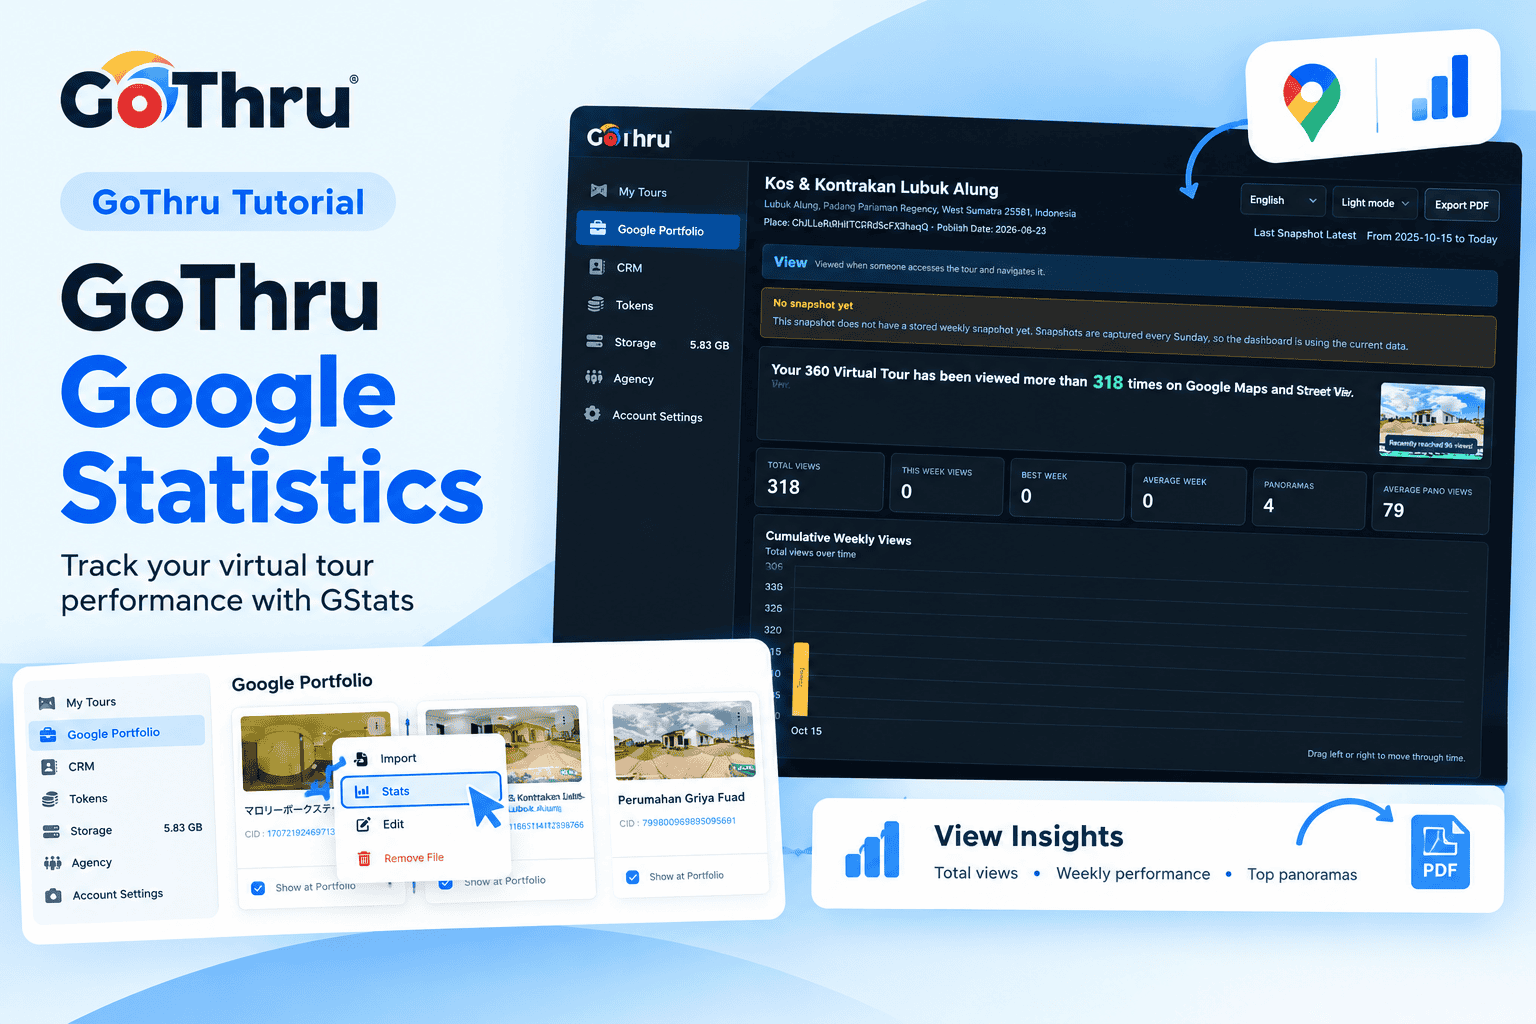
GoThru Google Statistics (GStats) helps you monitor the performance of your virtual tours published on Google Maps and Google Street View. The dashboard provides insights into tour views, weekly performance, and individual panorama engagement.
Use GStats to track changes in viewing activity, identify popular panoramas, review historical performance, and export reports as PDF files to share with clients or colleagues.
How to Access GoThru Google Statistics
Step 1: Open Google Portfolio
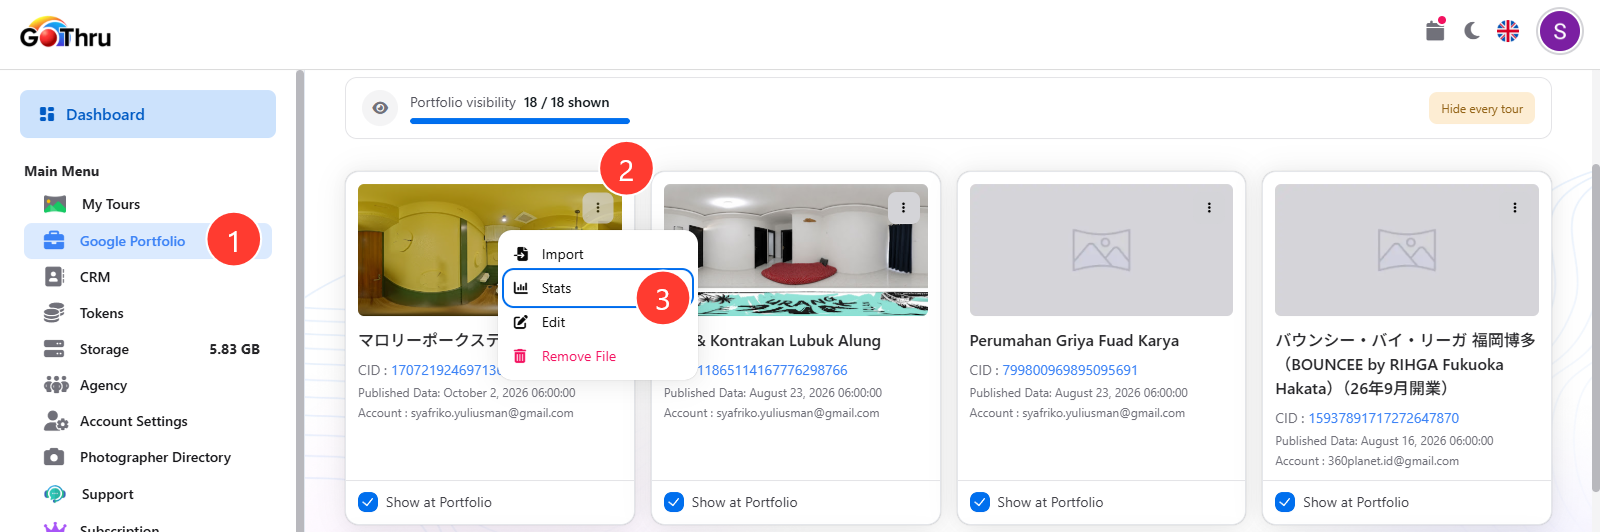
Log in to your GoThru account. From the left-side navigation menu, select Google Portfolio.
Step 2: Find Your Published Tour
Locate the tour whose statistics you want to review.
Click the three-dot menu in the upper-right corner of the tour card.
Step 3: Open Stats
Select Stats from the menu. GoThru will open the Google Statistics dashboard for that tour.
Step 4: Review the GStats Dashboard
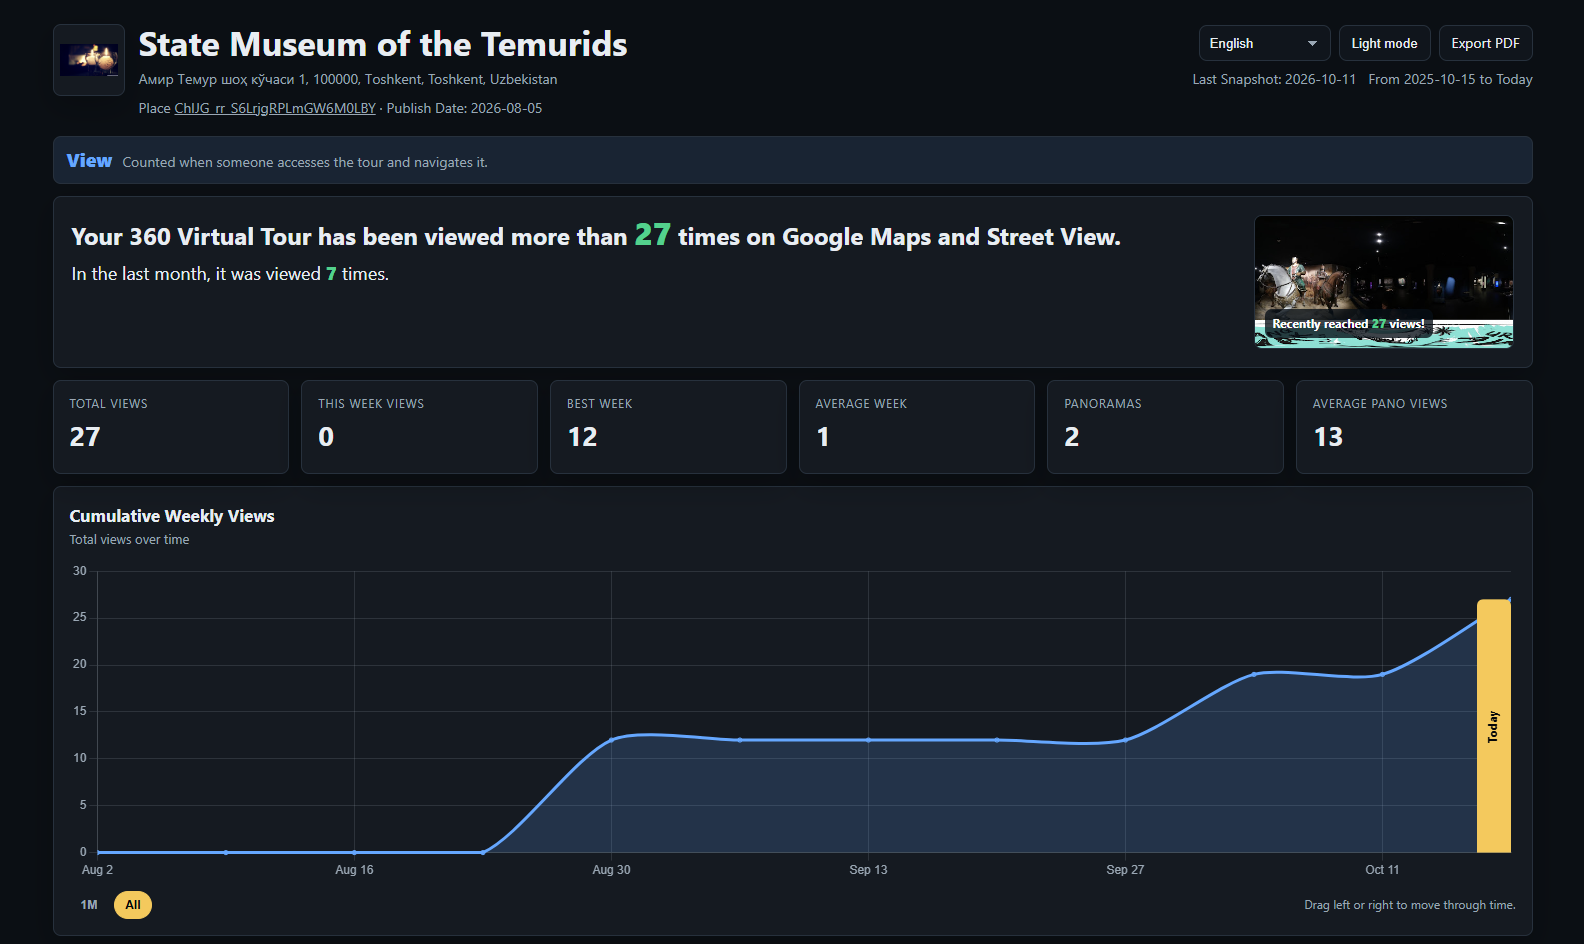
The dashboard provides an overview of the tour's performance and panorama-level statistics.
At the top of the dashboard, you can review information such as:
- Tour name: The name of the selected tour.
- Location: The tour's associated location.
- Place ID: The Google place identifier associated with the tour, when available.
- Publication date: The date the tour was published.
- Reporting period: The date range covered by the displayed statistics.
Check the reporting period before comparing results with another tour or report. If the dashboard provides date-range controls, select the period you want to review.
Step 5: Export the Statistics Report
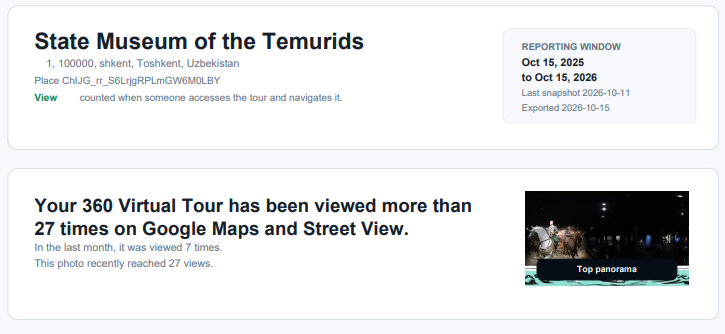
To save or share your tour statistics, click Export PDF in the upper-right corner of the dashboard.
Use the exported report for client updates, presentations, project documentation, or performance reviews.
Understanding the GStats Dashboard
Overview Metrics
The dashboard displays several key metrics to help you understand tour performance.
- Total Views: The total number of views recorded for the tour during the displayed reporting period.
- This Week Views: The views recorded during the current week.
- Best Week: The highest weekly view count shown in the dashboard's historical data.
- Average Week: The average weekly view count calculated by the dashboard.
- Panoramas: The number of panoramas included in the tour.
- Average Pano Views: The average panorama view count displayed by the dashboard.
These metrics provide a quick overview of viewing activity. For accurate comparisons, make sure the tours use comparable reporting periods and that you understand which metrics are cumulative and which represent a specific week.
Cumulative Weekly Views
The Cumulative Weekly Views chart shows how the tour's recorded views have accumulated over time.
Use this chart to understand the overall growth in viewing activity. An upward trend indicates that the cumulative number of recorded views is increasing.
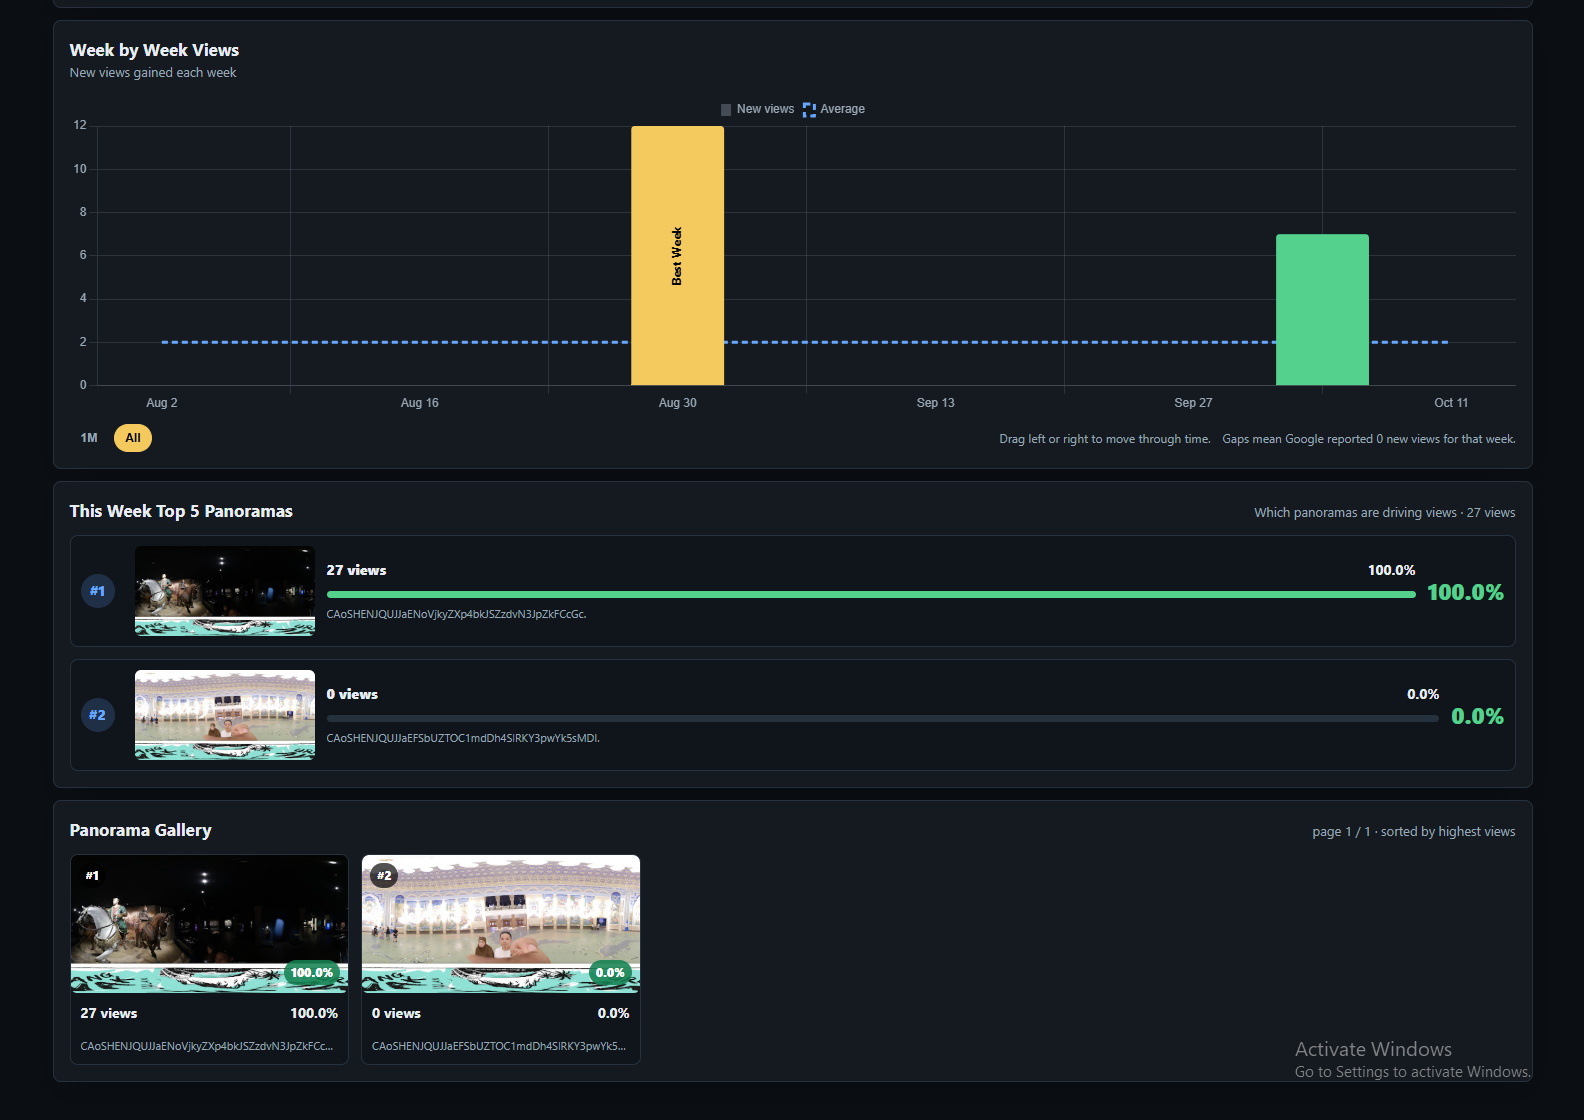
Week by Week Views
The Week by Week Views chart displays views recorded during individual weeks.
Use it to identify periods of higher or lower viewing activity and compare performance across weeks.
Labels such as W23 refer to a calendar week of the year.
This Week Top 5 Panoramas
The This Week Top 5 Panoramas section highlights the panoramas receiving the most views during the current week.
Depending on the dashboard display, you can review each panorama's thumbnail, view count, and percentage of recorded views. This helps you identify which images are attracting attention.
Panorama Gallery
The Panorama Gallery displays panoramas from the selected tour alongside their view counts and percentages.
Use the gallery to compare panorama-level performance and see which images receive more views than others.
Understanding Reporting Periods and Historical Data
GStats displays statistics for a defined reporting period. Always check the displayed date range when reviewing metrics or comparing reports.
Some historical charts rely on weekly snapshots. If a tour does not have a stored snapshot yet, historical data may be incomplete until the first weekly snapshot is imported. The dashboard may display current data from Google's Street View publishing data pipeline in the meantime.
For this reason, a chart with limited historical data does not necessarily mean the tour has received no views.
Tips for Using GStats
- Monitor performance regularly. Review weekly and cumulative views to understand changes in viewing activity.
- Compare equivalent periods. Use the same date ranges when comparing tours or evaluating performance over time.
- Identify popular panoramas. Review the top-performing panoramas and Panorama Gallery to understand which images receive the most attention.
- Allow time for historical data. Weekly snapshots may take time to become available for a tour.
- Share reports with clients. Export the dashboard as a PDF to communicate tour performance clearly.
Conclusion
GoThru Google Statistics gives you a convenient way to monitor published tour performance, review viewing trends, and compare panorama engagement. By checking the reporting period, understanding the dashboard metrics, and exporting PDF reports when needed, you can make better-informed decisions about your virtual tours and communicate their performance to clients.